Tutorial
The main class of this package is VzLog, which
manages an HTML output.
Creating a VzLog object
To start a log saving to the folder log, construct a new object as follows:
import vzlog
vz = vzlog.VzLog('log')
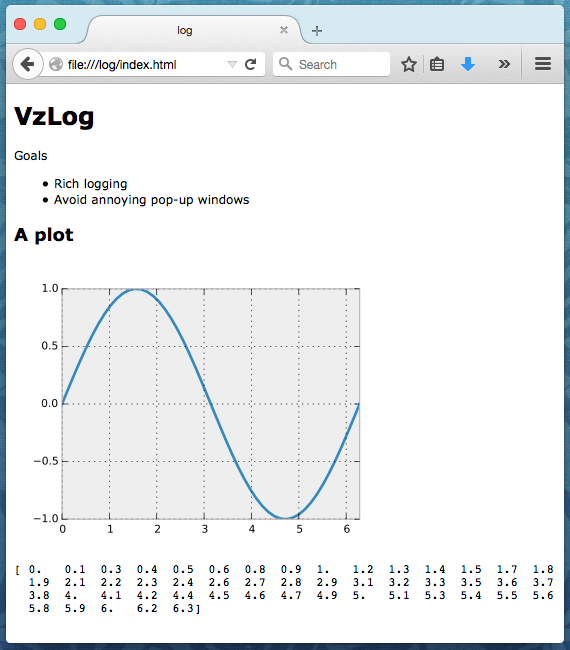
Refer to the VzLog for outputting functions. Here
is an example:
import vzlog
import vzlog.pyplot as plt
import numpy as np

vz = vzlog.VzLog('log')

vz.title('VzLog')
vz.text('Goals')
vz.items(['Rich logging', 'Avoid annoying pop-up windows'])

vz.section('A plot')
x = np.linspace(0, 2*np.pi)
fig = plt.figure(figsize=(4, 3))
plt.plot(x, np.sin(x))
plt.xlim((0, 2*np.pi))
plt.savefig(vz.impath('svg'))

np.set_printoptions(precision=1)
vz.log(x)
With the output saved to log/index.html:
Using the default VzLog object
Instead of manually creating a VzLog instance, it is more common to implement one that sets its path automatically:
>>> from vzlog.default import vz
This will draw information from the following environment variables:
VZ_DIR- Directory of all your VzLog outputs.
VZ_NAME- Directory name of your output.
VZ_FILE_RIGHTS- File rights of all your images.
The path of a default VzLog object is constructed by joining VZ_DIR and
VZ_NAME. This means that it is easy to keep a folder with many
different plotting documents. Here is an example where a new directory will be
used:
$ VZ_NAME=simple python examples/simple_test.py
You can also set these up more permanently by adding them to your
~/.bashrc:
export VZ_DIR=~/html
export VZ_NAME=plot
export VZ_FILE_RIGHTS=0775
In this example, your document file will be placed in
~/html/plot/index.html and the file rights 0775 mean that user/group can
read, write and execute and the rest can read and execute.
Plotting with matplotlib
When you are plotting directly to file, you want to tell matplotlib not to start an interactive session. You can do this as follows:
import matplotlib
matplotlib.use('Agg')
import matplotlib.pyplot as plt
Since this is such a common use case in vzlog, the following short-hand will do this automatically:
import vzlog.pyplot as plt
This will also tweak the rendering style.